
Financial Reports The Quickest Way
We covered how to realize financial statements before in this blog: Recipe For Crispy Profit & Loss Statements with Dynamic Sub Totals in Power BI As of April 2020 a much easier and elegant way is available. Drumroll…. Meet the new Acterys Reporting Visual that will also soon be launched on Appsource. Our friends from Acterys have done an amazing hob to help you to render professional financial reports in Power BI with typically required flexible formatting options and your own custom calculations the easiest way. Here are the steps:
Add Acterys Reporting Visual
Just add the visual with row groupings and measures or amount fields to the Power BI canvas:
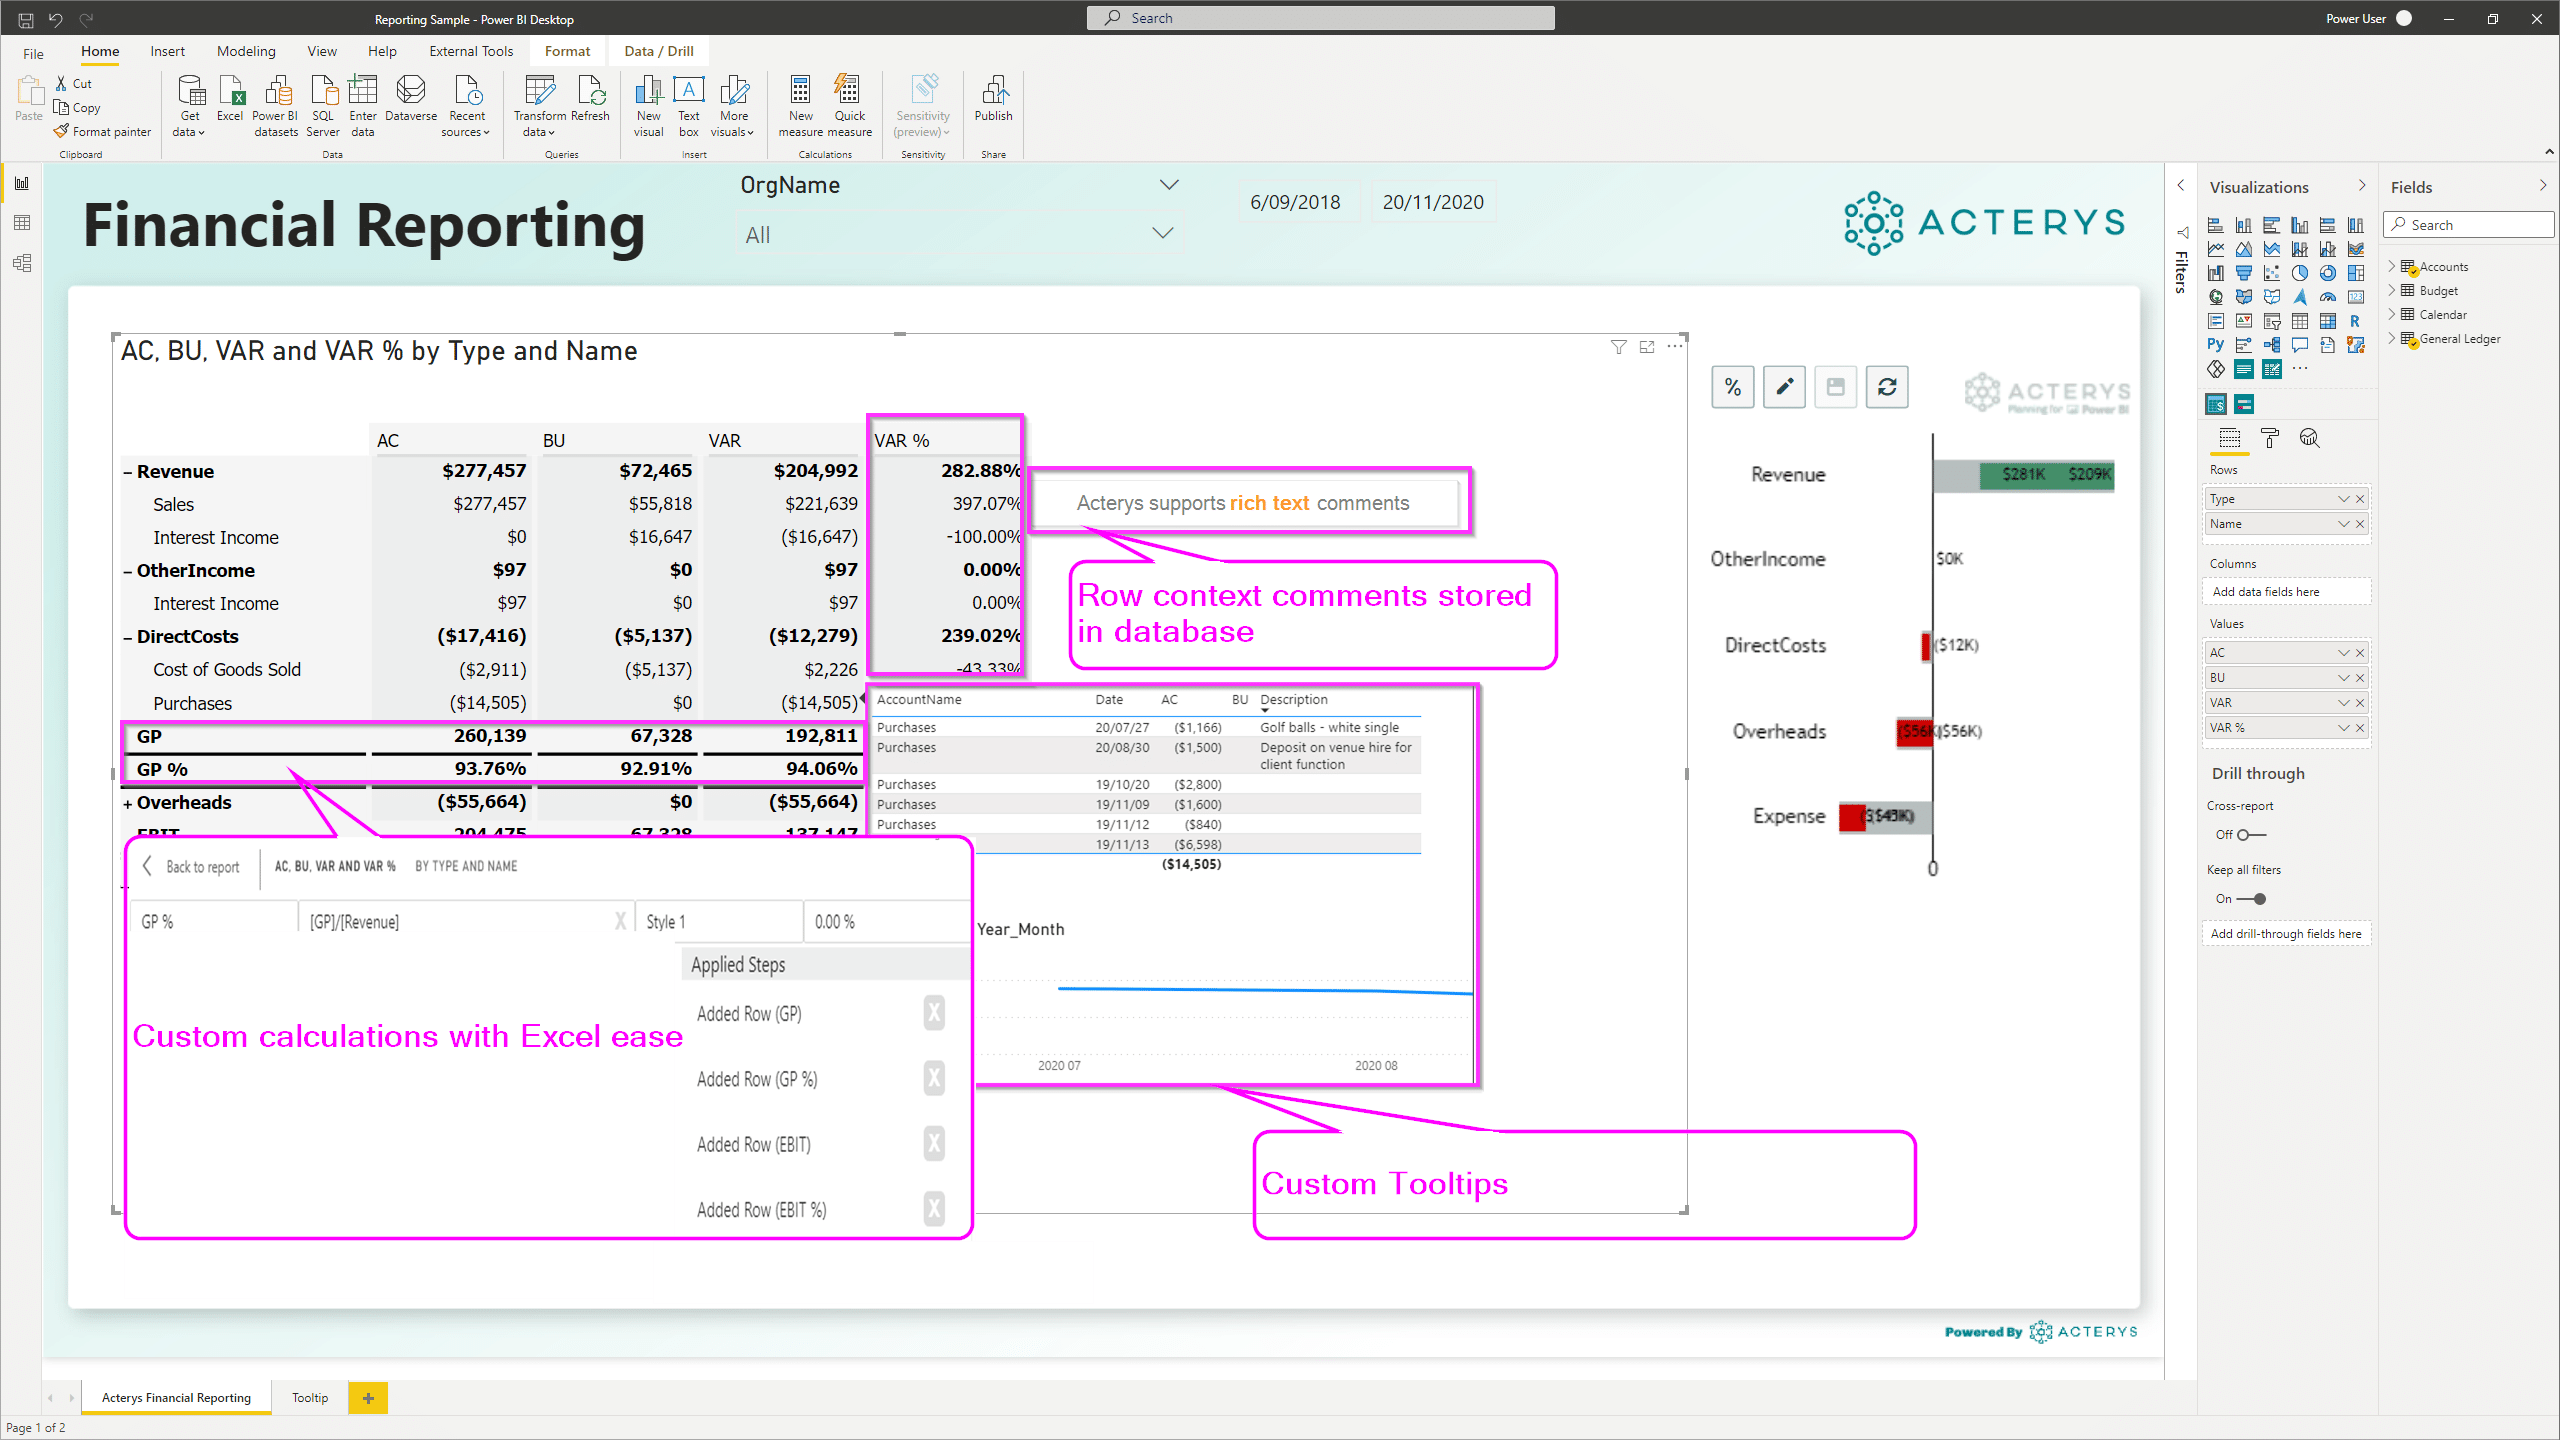
Financial Reporting in Power BI
Edit Calculations
Following that you can go to edit mode in the visual:
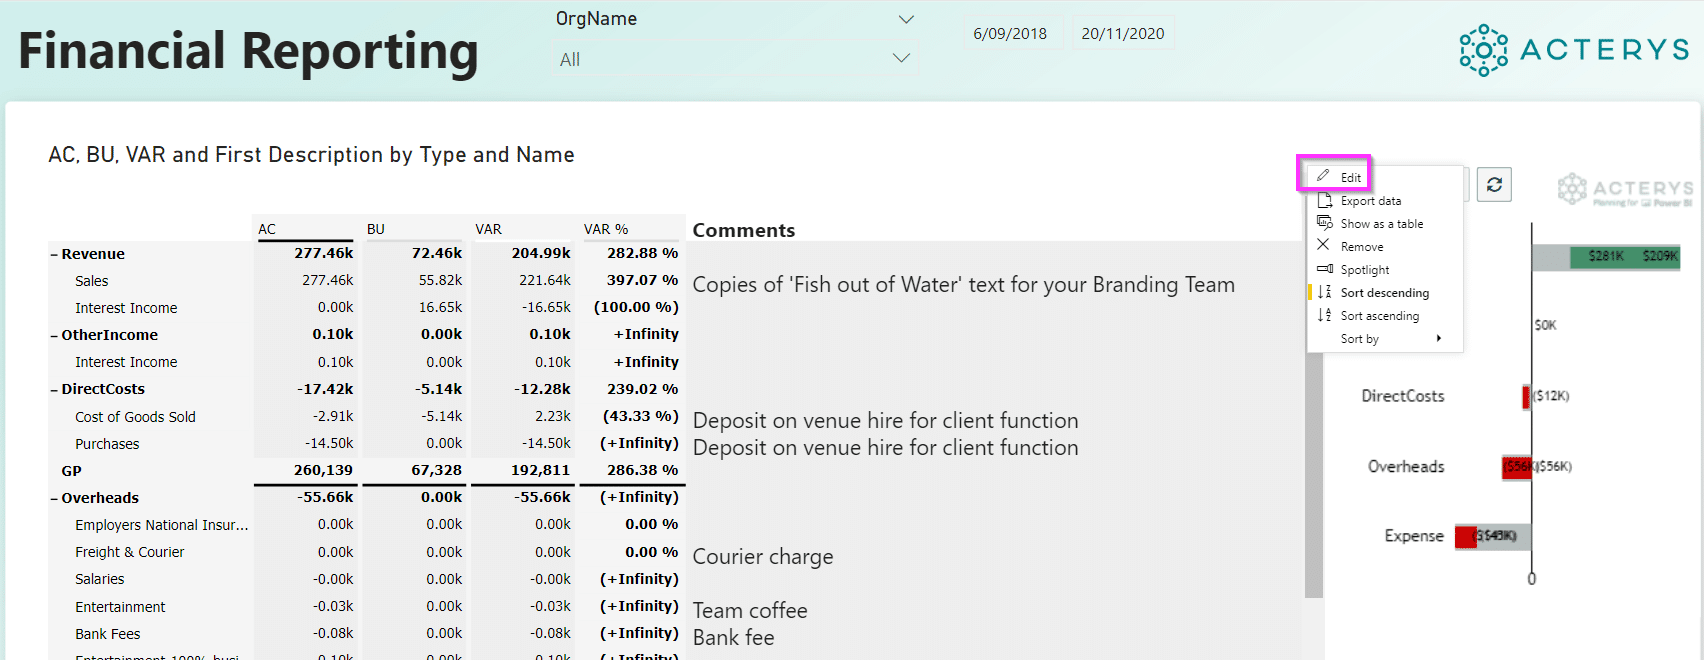
Edit Mode Acterys Reporting in Power BI
Here you can add now your row and column calculations with a right click and just clicking on the items that you want to use in the calculation:

Income Statement / Profit Loss Balance Sheet Calculation in Power BI
With the calculations and the report components in general you have extensive formatting options e.g. showing rows, columns with the number format, or scaling factor (K,M,..) required, using underlines, double underlines etc.
HTML Formatted Comments
In addition Acterys Reporting also supports html formatted comments just drag them to the Comments field and turn Comments on in the visual properties:
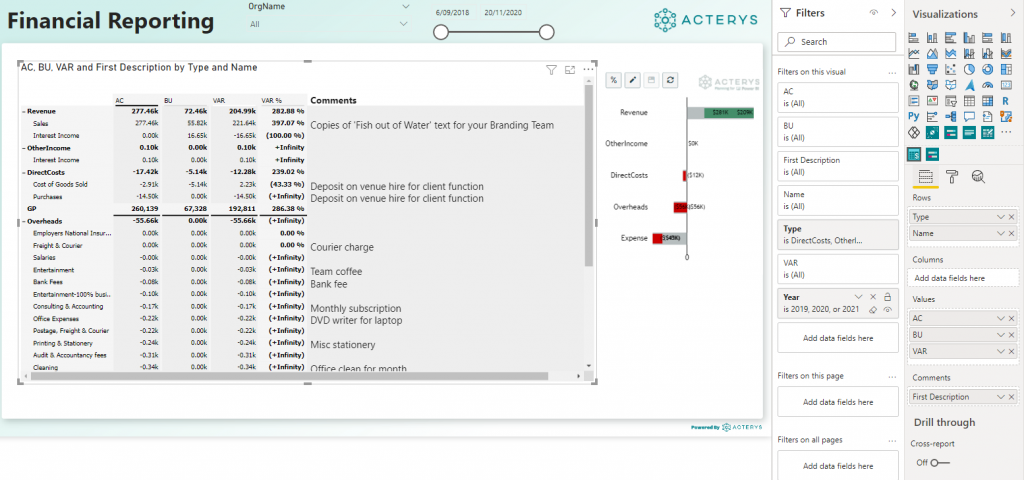
Comments in Power BI Desktop
And this is just the start… Watch out for soon to be released improvements like:
- Chart visualization according to IBCS
- Writeback
and other improvements