
Excel is still the tool of choice for most planning & forecasting processes but are new technologies like Power BI a better option? For single user planning requirements Excel is a great tool if there is not a lot of complexity in the data model and with minimal requirements to change model structures. As soon as multiple planners need to be involved and complex multi-dimensional aspects (e.g. using multi-level organizational, product, customer hierarchies, multi-currency) need to be considered, things change. For addressing these requirements planners are either using offline workbooks or a central data model approach with a live link in Excel.
Offline Workbooks
This method is based on sending data entry workbooks to users for them to enter their forecasts or plan numbers and send back to a central function for integrating this into the overall model. This initially takes a lot of effort for the workbooks to be made useful: First they need to adapt to the needs of that specific user e.g. showing their particular details (cost center, organizational entity, region etc.). A further requirement is to “secure” the workbook e.g to avoid that users inadvertently delete formulas and take steps to prevent entry errors as much as possible. Equally limiting with the offline approach is, that user never have the option to see immediately what effect their budget has on a total level as they can only see what they have just entered. For a “total” view all the offline workbooks have to be integrated. Things don’t get too much better after all the workbooks have been merged into the total budget/forecast. This nearly always also involves extensive work to integrate the disparate workbooks, likely uncovers errors which starts another lengthy iteration. Once you finally have the consolidated budget/forecast it is very difficult respectively impossible for planning admins to simulate top down changes.
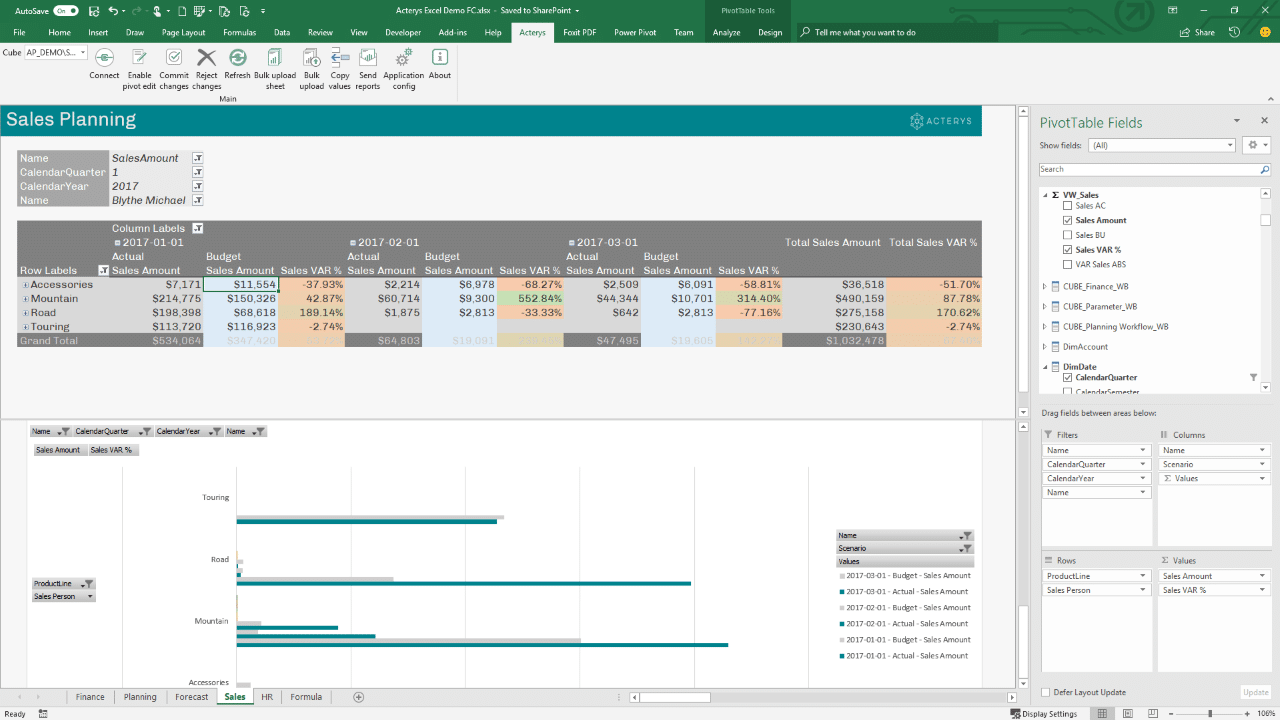
Live Link From Excel: Write-back from Pivot Table
Live Link To Data Model
This better method separates presentation (Excel) and storage and is available with different add-on products. We have covered the principle in one of our earlier blogs. Tools here include TM1, Alea (now Infor), Jedox, Paris Olap and Acterys (developed by our group company FP&A Solutions) utilize this approach, among others. These tools are client server based and use a single, central data model to which user connect with a read/write option live from the Excel workbook. This approach avoids the hassles described above: reports typically adapt automatically to changes, they enable interactive filtering and take into account varying user rights. The drawback here is: the entry users will need to have Excel and the respective Add-in installed (on that note: Microsoft please finally enable refresh of data sets in Excel Online – we have been begging for this for years…) An additional limitation is that the setup of more complex workflows and more advanced analytics methods are typically not that easy to implement.
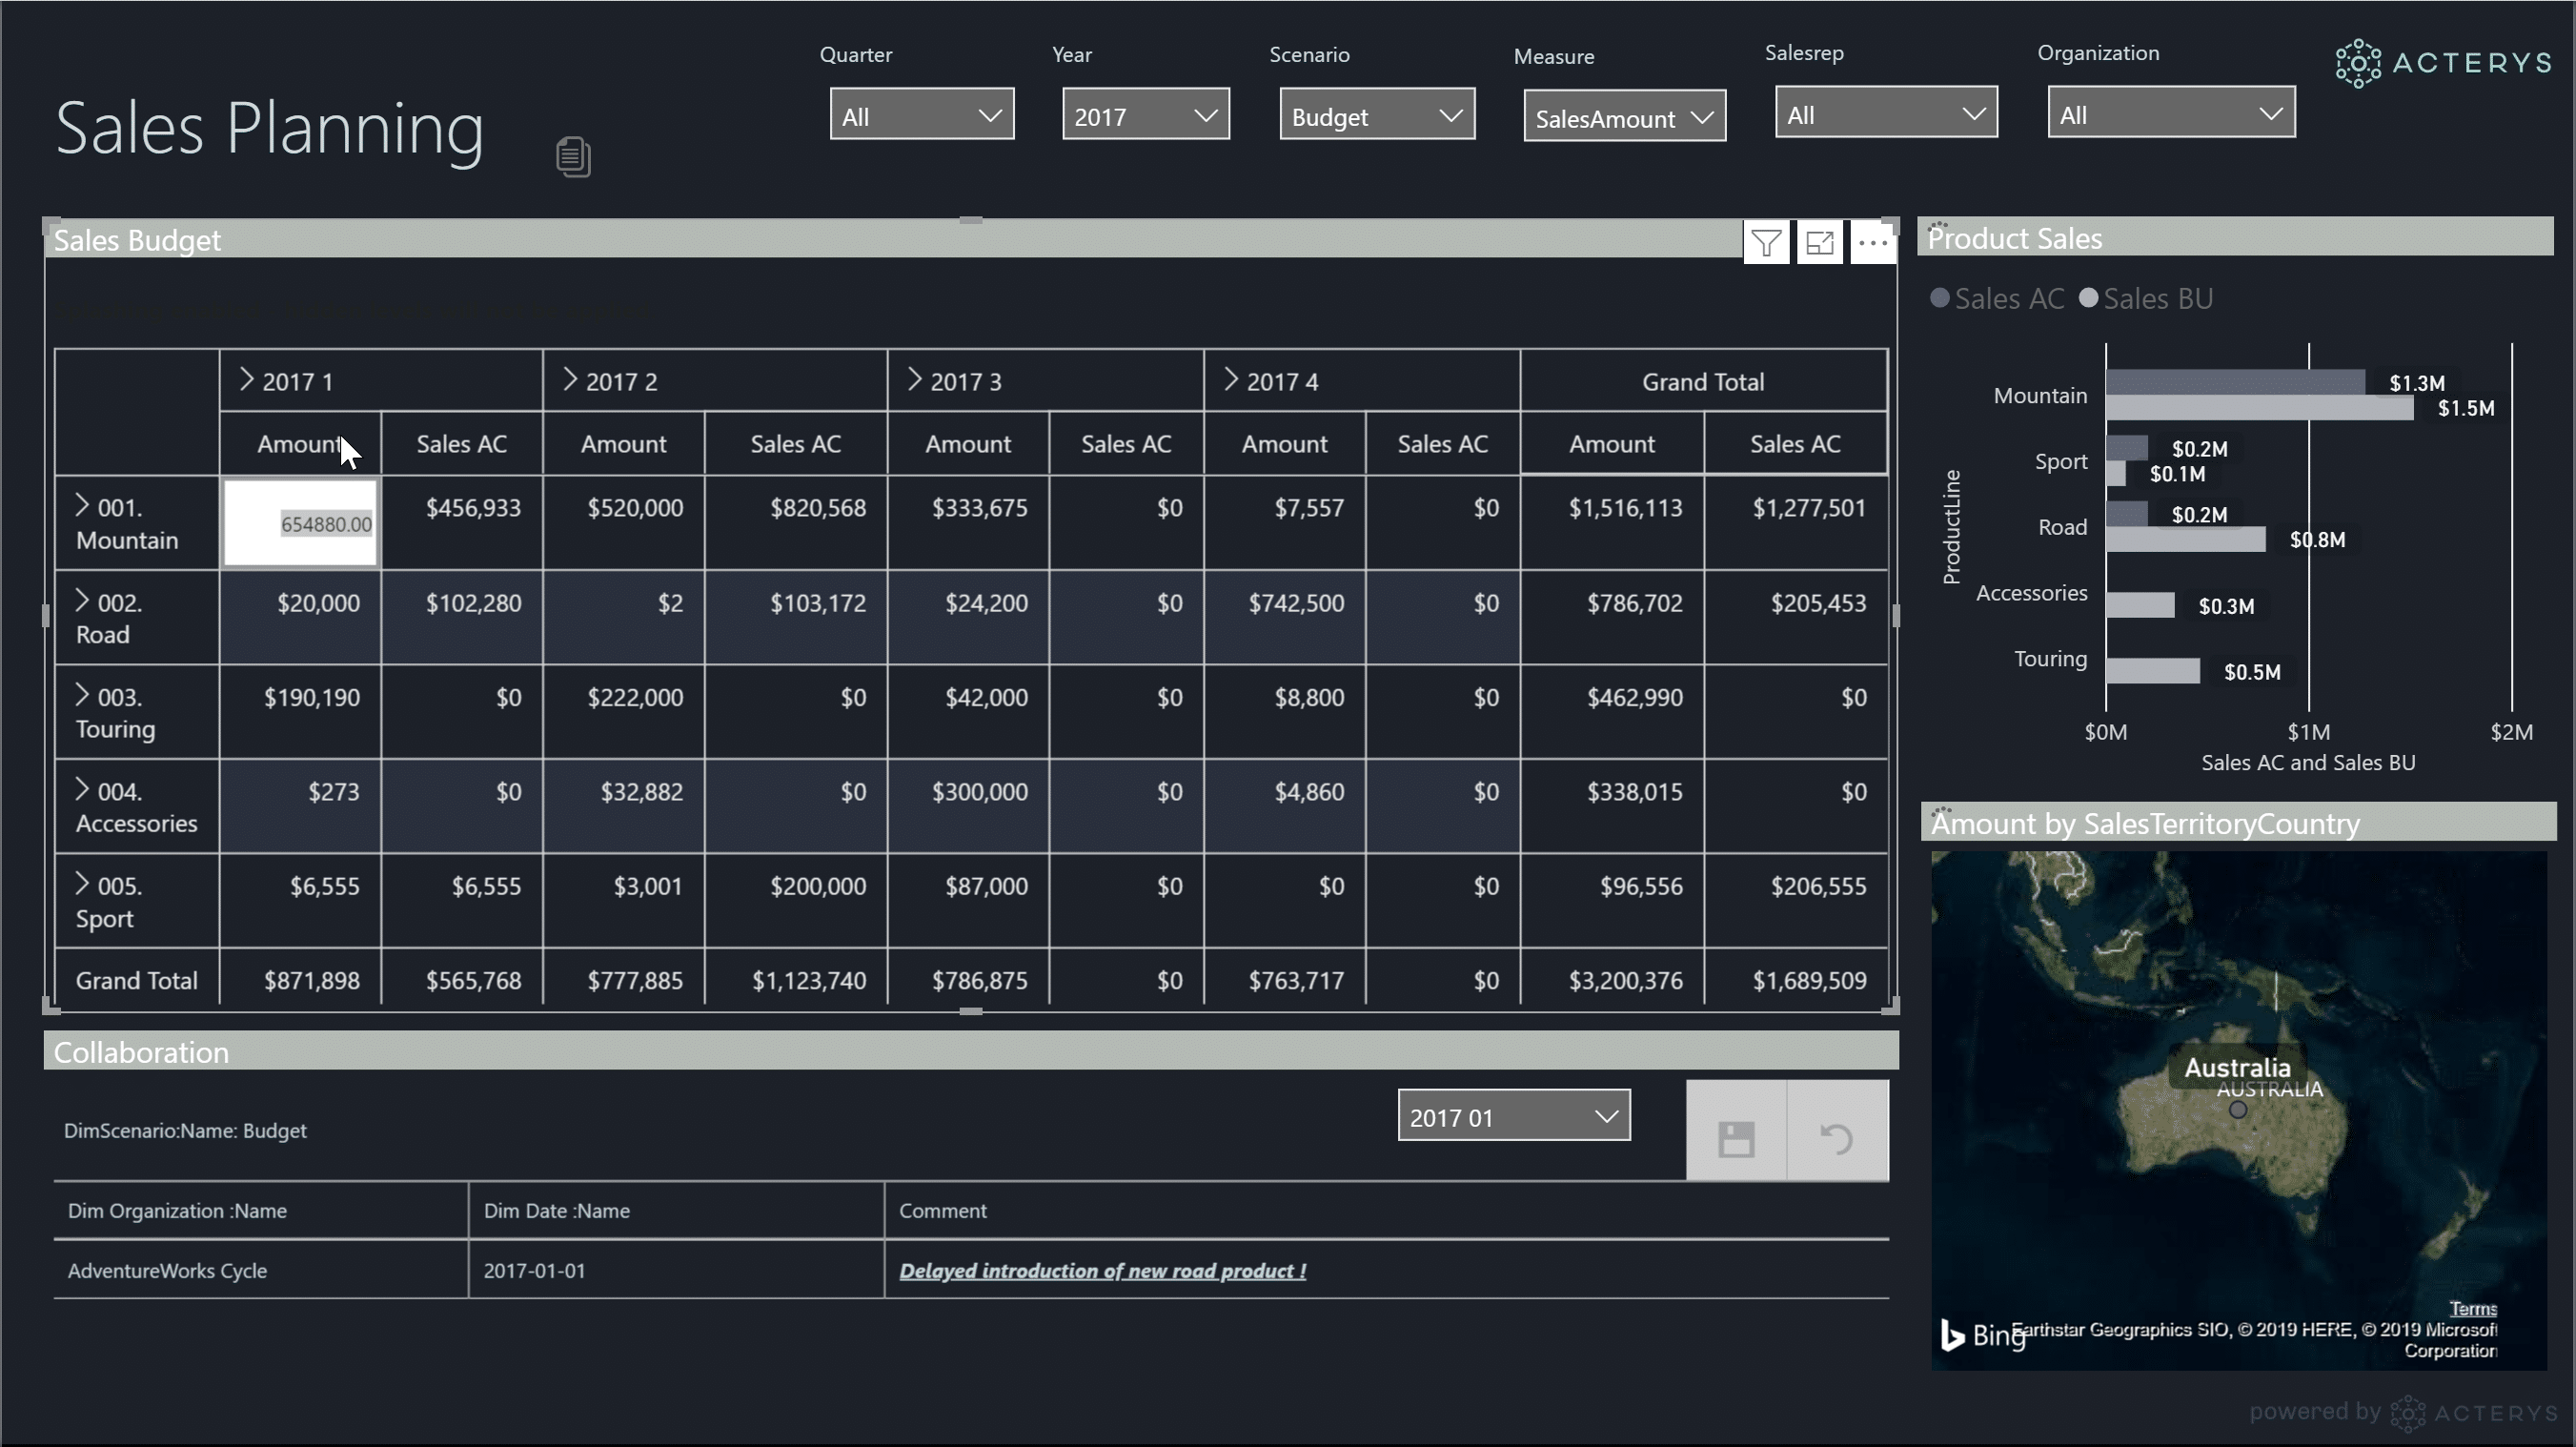
Top Down Bottom Up Write-back in Power BI
Power BI
On its own the data entry is limited in Power BI (you can capture single values with PowerApps) but with using a solution like Acterys it can turn into an extremely powerful planning environment:
Building Model/data integration
Data storage is managed in a similar fashion as in the single, central data model approach with the Live-Link Excel Add-in solutions. The models represent the required business structures (dimensions and hierarchies) and can be populated with actual data for comparison purposes. Acterys here has the advantage that models can be built automatically with Connectors to a variety of ERP systems.
Model Logic
Once the model is in place, the next step is to setup the calculation logic e.g. variances, relationships and drivers (e.g. 3-way forecasting combining Profit Loss, Balance Sheet and Cash Flow). Here Power BI’s DAX calculation language offers comprehensive options to setup the logic as needed. With DAX there is an initial learning curve as it works differently than you are used to in Excel, but once you have built a few models and “got your teeth into it” you will see that it is a very powerful calculation environment that enables you to get results in no time. Requirements like time intelligence calculations (Year to date, balances, variances etc.) that took days to implement in the legacy OLAP tools take a few minutes. Writing DAX functions is also extremely effective as it is supported by IntelliSense: a smart editing helper that suggests the possible options for your function and ensures that syntax and arguments are correct from the start. DAX has some limitations around recursive function requirements and loops that are better realized using SQL in the data model. Acterys here provides templates for typical financial calculation needs.
Write back
With the Acterys custom visuals you can design powerful matrix style data entry forms in minutes with the ease of Power BI by just dragging and dropping the required hierarchies in rows and columns. In the published visual, users with the relevant credentials have -without any further configuration- all typically budgeting/forecasting features at their fingertips from: Top down (entry on aggregates)/bottom up (entry on detail) data input, relative changes, using special distribution patterns to copying scenarios. The Acterys visual fully interacts with other visuals for example a selection of a Power BI slicer will filter it, respectively a click on a data entry cell will affect other Power BI visuals on the report. All this is governed by write back rights e.g. “User A” can write on “Forecast” for “Company X” but not “Actuals”.
Comparison to Excel?
- Easy distribution: end users only need a web browser and don’t have to install anything. It works on Apple iOS platforms and even on mobile devices.
- Extremely quick entry form creation: just drag and drop required fields
- Forms automatically adapt with changes in the data model: This minimizes maintenance requirements
- No need to worry about preventing users from changing cells of the form as in Excel.
- Comprehensive analysis features: Power BI visuals in addition to 200+ custom visualization and the option to build your own are available alongside your planning form in one unified system.
- Interactive analysis support: when you click on an object you can immediately see the effects on another. For example, when you enter data in the planning form cell a related metric or a map visual automatically updates to show the consequences of this entry.
- Extremely easy addition of workflows: Microsoft Flow and special apps functionality (PowerApps) e.g. scenario copy
- Simple integration with other data sources: Power BI allows you to add 200+ sources from databases to web services.
- Option to add advanced analytics and machine learning methods in Power BI: using the r and Python integration
- Transparency & governance The Process is completely governed by audit trails. All entries and model changes are tracked in a log with the details of the respective user and can be reversed if necessary.
In Conclusion
Our consultants -that have worked with Excel based solutions for most of their careers- were initially skeptical if Power BI can be used comprehensively for planning & forecasting but seeing the results AND preferences at our clients has really changed their minds. Not at least because most requirements take now half the time to implement than with spreadsheet based solutions or specialized planning applications. As much as there will always be use cases where “Excel excels” it really looks like Power BI will dramatically lower the necessity for using spreadsheets for financial processes like budgeting and planning. This is particularly the case on the contributor side where easy access alongside transparency and governance are the key priorities.